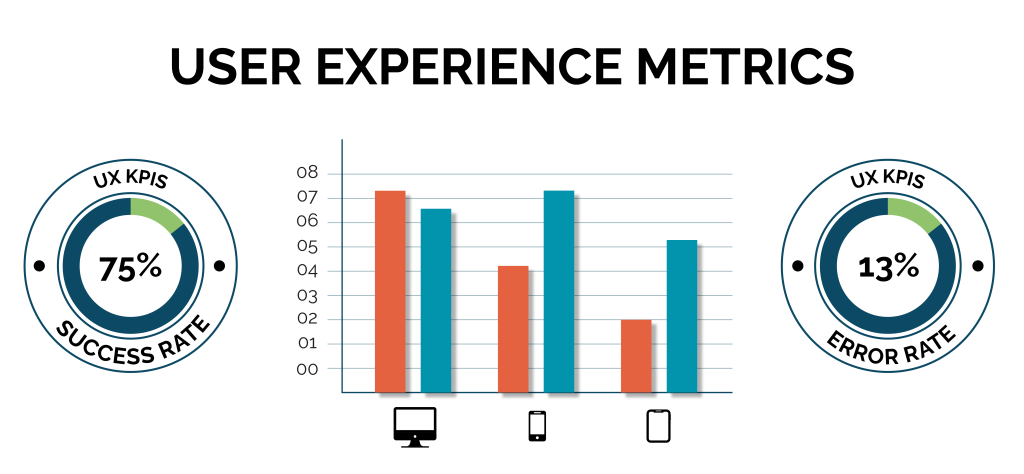
UX metrics are a set of quantitative data points. These metrics can be used to measure, compare and track user experience. They are, therefore, vital for ensuring that UX design decisions are informed by relevant facts and measurable data.
Is your design strategy working? How are your designs working over time? Are your designs serving your user base? The number of UX metrics is always growing, so you may be tempted to ask, “Which metrics are most valuable for my project?”
Below we explore two of the key UX metrics and how you can use these metrics to inform your designs and products.
Behavioral Metrics
Behavioral metrics tell you how users interact with your product and the issues they may have had. Many of the behavioral metrics mentioned below are relevant to a design’s usability, which is an integral part of UX.
Good usability is key to ensuring that users are happy with your product and don’t start looking for alternatives. Behavioral metrics can be collected using digital analytic tools or during lab usability testing.
1. Time on Task
Time on task is the time that a user spends doing a particular activity. It is usually measured in seconds, minutes, or hours. This metric is ideal for task-focused activities that need to be efficient. For example, you can track the time it takes for users to complete an online shopping experience.
2. Average Session Length
This metric measures user engagement. Normally, the more time users spend using your design or product, the more engaged they are.
3. Abandonment Rate
The abandonment rate is the ratio of the number of abandoned purchase attempts to the overall number of initiated transactions. This metric is relevant to the online shopping experience. A high abandonment rate is a key indicator that something is wrong with your checkout experience.
4. Error Rate
The error rate is the number of users who make errors while completing a task. If users accidentally choose the wrong option or enter data incorrectly, this can be tracked. These kinds of errors often relate to usability issues. Once you know more about the kinds of errors users are encountering, you can start solving them.
Attitudinal Metrics
Attitudinal metrics will give you an idea of how users perceive your product. Examples of attitudinal metrics include Adoption (Which features do people use?), Satisfaction (Do users enjoy your product?), Credibility (What are the levels of user trust?), and Loyalty (Do users want to return to use your product or service again?).
1. Daily/Monthly Active Users (DAU/MAU)
Measures-Loyalty
How many users do you have? Tracking the number of users you get on a daily or monthly basis will help you measure user retention. The DAU/MAU ratio, also known as stickiness, is about how many users engage with your product on a regular basis. For example, an MAU ratio of 50% means your users engage with your product or service 15 out of 30 days.
2.Net Promoter Score (NPS)
Measures-Loyalty
Net Promoter Score (NPS) is measured using a survey that asks users one question- “How likely is it that you would recommend our product to a friend or colleague on a scale from 1 to 10?” Those who respond with a score of 0 to 6 = are detractors. Those who respond with a 7 or 8 = are passive. And those who respond with a score of 9 or 10 = promoters. Then a final NPS score is calculated by subtracting the percentage of detractors from the percentage of promoters.
3. User Retention Rate
Measures-Loyalty
User Retention Rate is the percentage of users you have retained over a period of time. It is an indicator of whether your retention strategy is working. It is calculated by subtracting the number of acquired users during a period from the number of users at the end of the period divided by the number of users at the beginning of the period.
4. Customer satisfaction score (CSAT)
Measures-Loyalty and Satisfaction
The CSAT is an indication of how satisfied a user is with a particular interaction or with the overall experience. A CSAT is gathered using a survey or questionnaire. This is a measure of a specific part of your product rather than the more generic NPS metric. The downside to this metric is that many users will not take the time to fill out the survey.
5. System Usability Scale (SUS)
Measures-Loyalty and Satisfaction
The System Usability Scale (SUS) is a set of questions that you allow to assess the usability of a product. It usually consists of 10 to 12 statements that users need to rate on a scale (Strongly Disagree – Disagree – Agree – Strongly Agree). SUS requires a relatively small sample size but can still provide you with some valuable user experience data.
Summary
Unfortunately, there is no universal set of UX metrics that works for every project. The best way to explore UX metrics is to understand your business model, your business goals, and your ideal user base. What are the models and KPIs that your company tracks? What do you need to pay attention to? Learn what has a significant impact on your bottom line and use metrics to help you grow your knowledge.
It is also important to tie these UX metrics to design decisions. You will then be able to track changes over time, benchmark against iterations, and measure your product evolution. You will also see whether your design and product designs have reaped the results you expected.
Finally, remember that data only tells part of the story. Data allows you to understand what’s happening, but it may struggle to tell you why it’s happening. Alongside data, it’s essential to conduct qualitative studies such as contextual inquiries and user interviews. Together, UX metrics and qualitative research will help you create a comprehensive vision of your product and how it performs.
To learn more about exploring UX metrics, feel free to get in touch with our UX experts.